

Could 2026 topple the console pecking order?
It’s a pivot year for PlayStation, Xbox, and Nintendo.
Switch 2’s rapid start, GTA VI’s launch, and rising subscriptions are already pulling market share in new directions.
This report cuts through the noise with clear projections for 2026 and the forces behind them.
You’ll get where growth will come from, who stands to gain or lose, and the key moves that matter.
Read on to see the scenarios that change strategy and profits.
Forward-Looking Console Market Outlook and 2026 Market Share Projections

2026 is a pivot year. PlayStation held about 45% of the global console market coming out of 2025, Xbox sat around 27%, and Nintendo grabbed roughly 24%. That’s stable on the surface, but the forces pulling at those numbers are speeding up. The broader console market is tracking toward USD 78 billion by 2032, growing at 5.2% annually, and 2026 sits right at the start of that climb. U.S. consumer spending alone is expected to hit $62.8 billion in 2026, up 3% and beating the old high of $61.7 billion from 2021.
Nintendo’s Switch 2 became the fastest-selling home console in the U.S. after just seven months. Its second full year in 2026 should push hardware, software, and digital engagement even harder. Grand Theft Auto VI drops in November 2026 and has posted the highest purchase intent ever tracked, a surge that’s expected to lift hardware, accessories, and subscriptions across all three platforms. Subscription spending grew throughout 2025 and looks set to keep climbing in 2026 as people lean toward library access instead of paying full price for individual games.
What’s shaping 2026 market share:
- Hardware cycle momentum. Switch 2’s fast start and mid-generation refresh windows for PlayStation and Xbox.
- Major software impact. GTA VI in November, plus Resident Evil: Requiem, Pokémon: Pokopia, and Marvel’s Wolverine.
- Subscription growth. Game Pass, PlayStation Plus, and Nintendo Switch Online driving repeat revenue and keeping users locked in.
- Regional expansion. Asia-Pacific and Latin America are the fastest-growing user bases. North America and Europe still bring in the most revenue.
- Technology differentiation. SSD adoption, cloud gaming integration, AI-assisted rendering, and energy-efficient chipsets all influence which platform people pick.
Historical Console Market Performance Review (2020–2025) to Inform 2026 Analysis
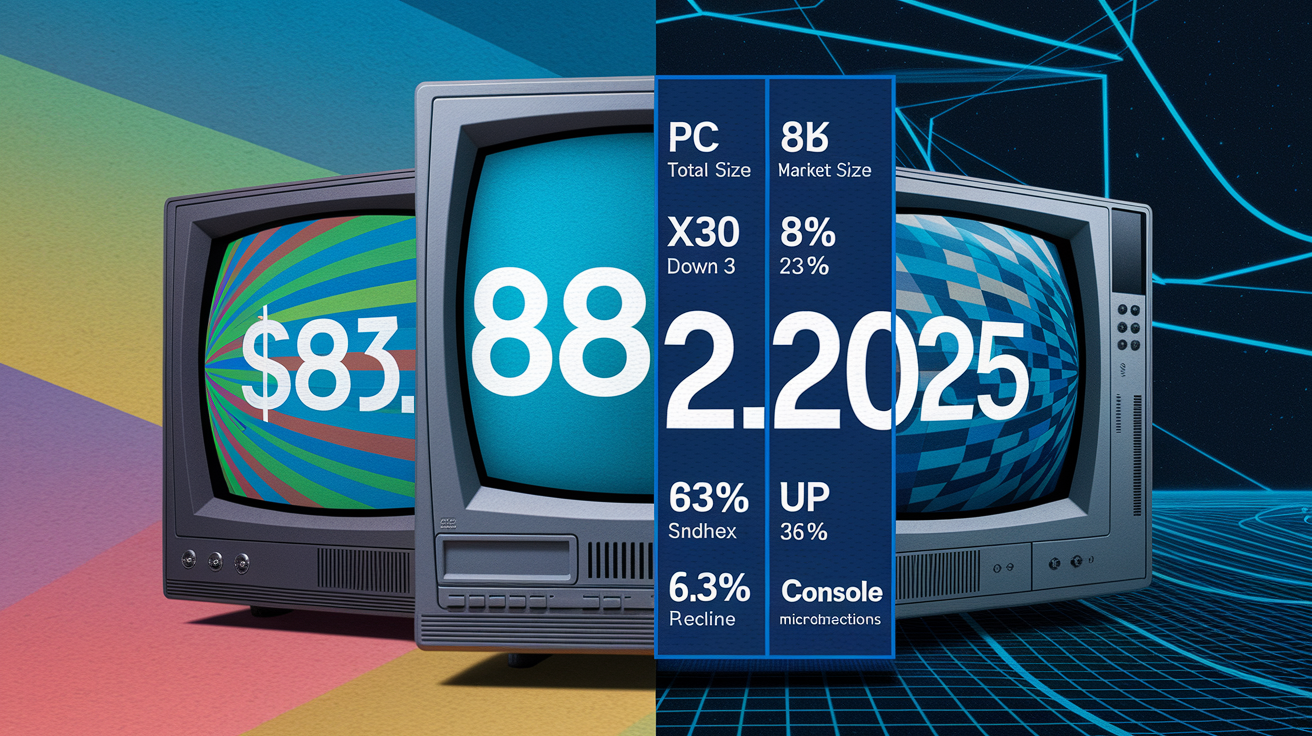
The combined PC and console gaming market reached $88.3 billion in 2025. That ended a five-year flat period and marked the return of real growth. Console players numbered 645 million in 2025, with forecasts pointing to 688 million by 2028 at a 2.2% compound annual growth rate. PC gaming audiences are expanding faster, climbing from 936 million in 2025 toward 1.02 billion by 2028. The gap in growth rates means console makers need to defend engagement and monetization even as total user counts edge up.
Engagement and revenue trends from 2020 through 2025 show platform-specific swings that directly inform 2026 models. Total playtime across PC and console games fell 1% in 2025, but the distribution shifted. PC playtime rose 3% year-over-year, Xbox playtime dropped 3%, and PlayStation playtime fell 4%. Console microtransactions, a critical revenue stream, declined 6.3% in 2025. It was the only declining segment across the broader market. Genre performance shifted hard too. Sandbox titles surged 36% in playtime, driven mainly by Roblox and Minecraft, while Battle Royale engagement collapsed 27% as Fortnite playtime fell 29% and Apex Legends dropped 24%. These shifts suggest younger, mobile-first demographics are pulling time away from traditional console franchises.
| Year | Key Performance Indicator | Notes |
|---|---|---|
| 2020–2024 | Market stagnation | PC and console combined revenue flat. Supply constraints and release delays cited as main factors |
| 2025 | $88.3B total market size | Growth resumed. Console microtransactions down 6.3%. PC buy-to-play sales up 17.4% |
| 2025 | Console audience 645M | PC audience 936M. Console CAGR 2.2% vs PC 2.9% through 2028 |
| 2025 | Playtime shifts | PC up 3%, Xbox down 3%, PlayStation down 4%. Total time down 1% YoY |
| 2025 | Genre dynamics | Sandbox up 36% (Roblox overtook Fortnite as #1 by time). Battle Royale down 27%. Shooter down 5% |
| 2025–2028 | Revenue crossover forecast | PC expected to overtake console in total revenue by 2028 |
Regional Console Market Breakdown for 2026 Share Modeling

North America and Europe remain the biggest console revenue bases in absolute terms. High average revenue per user, mature digital infrastructure, and deep brand loyalty among core gamers anchor these regions. The United States alone is expected to contribute $62.8 billion across hardware, content, and accessories in 2026. Revenue data for the UK, Germany, France, Spain, and Italy collectively underpin European market sizing. These mature markets show slower audience growth but higher attach rates for premium software, subscriptions, and accessories, making them critical to profitability even as volume expansion slows.
Asia-Pacific and Latin America are the fastest-growing console markets by user count. Rising broadband penetration, younger demographics, and increasing adoption of digital-only and handheld-hybrid form factors drive this. Engagement data from 37 monitored markets shows strong momentum in these regions, though revenue coverage remains limited to the six Western markets noted earlier. China and India are excluded from the engagement metrics provided, creating significant gaps in global audience and average revenue per user modeling. Younger players in Asia-Pacific and Latin America lean harder toward digital downloads, free-to-play titles, and portable gaming devices. These trends favor Nintendo’s Switch 2 and create headwinds for traditional home consoles from Sony and Microsoft.
Strongest 2026 regional drivers:
- Demographics. Asia-Pacific and Latin America skew younger. Sandbox and social gaming titles dominate playtime. These audiences are less brand loyal and more platform-agnostic.
- Broadband infrastructure. Expanding high-speed internet access in emerging markets enables cloud gaming, digital downloads, and live-service engagement. This reduces reliance on physical retail.
- Digital adoption. Emerging markets increasingly bypass physical media, speeding the shift to digital-only consoles and subscription bundles.
- Handheld and hybrid demand. Portable and console-tablet hybrids resonate strongly with mobile-first users in APAC and LATAM, giving Nintendo a structural advantage in these growth pockets.
Platform-Specific 2026 Market Share Considerations for PlayStation, Xbox, and Nintendo

PlayStation’s 2025 performance reveals a platform under engagement pressure. Playtime declined 4% year-over-year while it maintained the largest installed base and highest revenue concentration among the three incumbents. Revenue on PlayStation depends heavily on a narrow set of franchises. EA Sports FC and NBA 2K alone accounted for 24.3% of all PlayStation revenue in 2025. This concentration creates both stability and risk. It locks in annual revenue from sports titles while leaving the platform vulnerable to genre shifts and younger demographics migrating toward Sandbox and social titles. PlayStation’s free-to-play revenue fell 8.2% in 2025, a worrying signal given the importance of live-service monetization to long-term retention.
Xbox experienced a 3% decline in playtime during 2025 but showed the highest share of new-release engagement at 18%. This was driven mainly by Game Pass’s library rotation and day-one availability for first-party titles. Xbox focuses most on capturing early adoption cycles, though free-to-play revenue on Xbox collapsed 23.6% in 2025, the steepest drop among the three. Monetization per hour of play on Xbox runs at about one-third the rate of PC, suggesting that while Game Pass drives volume, it compresses per-user revenue. The service’s value proposition appeals to price-sensitive consumers, a demographic likely to expand in 2026 if component-cost pressures push hardware and software prices higher.
Nintendo’s competitive position shifted dramatically with the Switch 2, which became the fastest-selling home console in the United States after seven months on the market. The device’s hybrid form factor, portability, and appeal to younger demographics position it to capture share in both mature and emerging markets. Console microtransactions across all platforms declined 6.3% in 2025, but Nintendo’s installed base and first-party software attach rates have historically insulated the company from third-party monetization volatility. The combination of hardware momentum, exclusive franchises like Pokémon: Pokopia, and handheld-hybrid demand suggests Nintendo is positioned to expand its ~24% baseline share in 2026, likely at the expense of PlayStation and Xbox engagement in younger demographic segments.
Nintendo’s Switch 2 Acceleration and Its Influence on 2026 Share
Switch 2’s first seven months on the market delivered the fastest console launch in U.S. history. That trajectory carries real implications for 2026 market share dynamics. The device’s second full year typically represents peak hardware sales in a console lifecycle, and the combination of supply stability, expanding software library, and holiday seasonality is expected to drive sustained unit sales throughout 2026. Unlike PlayStation and Xbox, which compete mainly on graphics performance and third-party exclusives, Switch 2 occupies a distinct niche. Portable play, local multiplayer, family-friendly IP. This positioning insulates Nintendo from direct head-to-head competition for the same user segments, allowing the company to grow share without necessarily eroding Sony or Microsoft’s core audiences. But the device’s appeal to younger players and mobile-first users does represent a long-term threat to traditional console ecosystems. These demographics form habits and brand preferences that persist into adulthood.
Revenue and Monetization Trends Impacting 2026 Console Market Share

Console game sales represented 50% of all console revenue in 2025. That underscores the platform’s continued reliance on premium software pricing even as digital distribution, subscriptions, and microtransactions reshape the broader market. Yet console microtransactions fell 6.3% in 2025, the only declining revenue segment across the entire gaming landscape. This contraction signals either saturation in existing live-service titles or a shift in consumer spending toward PC and mobile platforms, where free-to-play monetization continues to grow. PC buy-to-play revenue surged 17.4% in 2025, suggesting consumers are willing to pay for content but may be reallocating budgets based on platform value perception and library access.
Subscription services have emerged as a critical retention and revenue stabilization tool heading into 2026. Subscription spending grew throughout 2025 and is forecast to keep expanding as consumers prioritize perceived value over individual full-price purchases. Game Pass and PlayStation Plus function as engagement anchors, keeping users within their respective ecosystems and reducing churn. But the revenue trade-offs are significant. Subscriptions improve lifetime value and reduce piracy, yet they also compress per-title revenue and shift risk from consumers to platform holders. Revenue concentration on consoles remains high. More than 60% of console revenue comes from the top 20 franchises, creating dependency on annualized sports titles, established shooters, and long-tail live-service games.
Key monetization dynamics influencing 2026 share:
- Subscription bundling drives retention and reduces churn, but compresses per-user revenue compared to buying games individually.
- Digital-only console sales are rising, particularly among younger demographics. This reduces retailer margins and speeds the shift to direct platform monetization.
- Microtransaction decline on consoles suggests either market saturation or migration of spending to PC and mobile free-to-play ecosystems.
- Top-franchise dependency creates revenue stability but limits platform differentiation and exposes manufacturers to single-title performance risk.
- ARPU pressures are most acute on Xbox, where monetization per hour runs at one-third the rate of PC. Subscription growth alone can’t close that gap.
- Potential disruptors like Valve’s upcoming Steam Machines could pull PC-curious console users if priced competitively and marketed as plug-and-play alternatives.
Hardware Trends and Technology Factors Shaping 2026 Market Share

Rising component costs for RAM, GPUs, CPUs, and storage represent the most significant hardware headwind for 2026 console market share. AI data center demand competes for the same semiconductor capacity, driving these cost pressures. These threaten to either compress manufacturer margins or force price increases at retail, both of which hurt Sony and Microsoft more than Nintendo. PlayStation and Xbox rely on cutting-edge graphics performance and high-capacity SSDs to differentiate from Nintendo’s hybrid approach, making them more exposed to component shortages and cost inflation. If hardware prices rise, survey data suggests 38% of consumers would purchase fewer full-price games at launch, 34% would wait for sales, and 27% would shift time toward free-to-play titles. That behavioral cascade would erode both hardware and software revenue.
Energy-efficient chipsets and widespread SSD adoption have become table stakes rather than differentiators, but they remain critical to maintaining competitive performance. Cloud gaming integration is accelerating across all three platforms, enabling cross-device play and reducing friction for users who want to start a session on console and continue on mobile or PC. This flexibility benefits ecosystems with robust subscription services like Game Pass and PlayStation Plus, but also opens the door for users to question the need for dedicated hardware if cloud performance reaches parity. Emerging AR and VR accessories remain niche in 2026 but represent a long-term battleground, particularly for Sony, which has invested heavily in PlayStation VR2.
Digital-only and hybrid-handheld consoles keep gaining traction. This trend favors Nintendo’s Switch 2 and positions Sony and Microsoft to release lower-cost, disc-free SKUs as entry points. The potential entry of Valve’s Steam Machines, a PC-focused console alternative, introduces uncertainty into 2026 share modeling. If priced competitively and marketed well, Steam Machines could attract PC-curious console users who value flexibility and backward compatibility over exclusive first-party titles.
| Tech Factor | 2025 Status | Expected 2026 Influence |
|---|---|---|
| Component costs | Rising for RAM, GPUs, CPUs, storage due to AI demand | May force price increases or margin compression. Hurts Sony and Microsoft more |
| Cloud gaming | Integration accelerating. Cross-device play expanding | Reduces hardware lock-in. Benefits subscription ecosystems. Raises “do I need a console?” question |
| SSD adoption | Widespread. Now baseline expectation | No longer a differentiator. Cost increases may delay upgrades |
| Digital-only and hybrid | Growing among younger demographics | Favors Switch 2 and lower-cost disc-free SKUs. Speeds direct platform monetization |
Consumer Behavior, Demographics, and Price Sensitivity Affecting 2026 Market Share
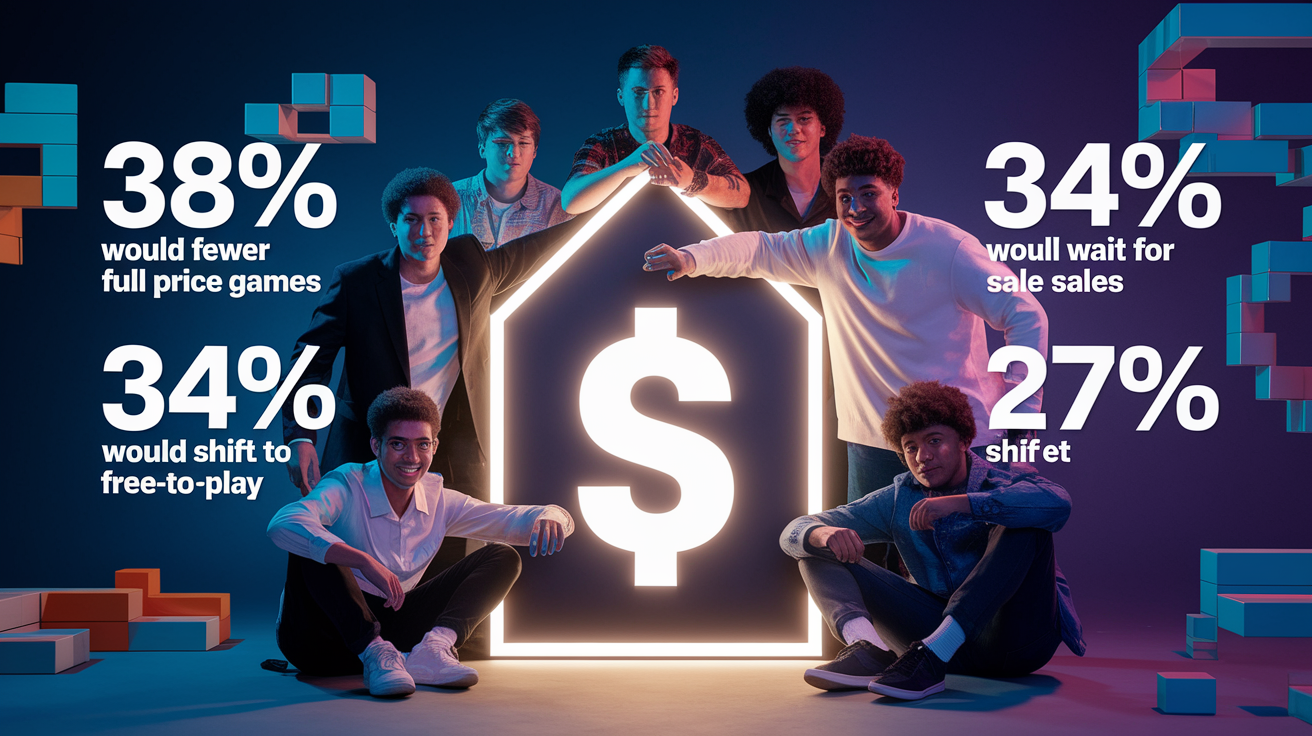
Price sensitivity is the defining behavioral constraint shaping 2026 console market share. Survey data reveals that 38% of consumers would purchase fewer full-price games at launch if costs rise, 34% would wait longer for titles to go on sale, and 27% would spend more time on free-to-play games. These responses suggest any hardware or software price increases triggered by component-cost inflation will trigger a defensive shift in spending patterns. Day-one sales compress, the tail for discounted titles extends, and migration toward free-to-play ecosystems accelerates. This dynamic hurts platforms that rely on premium software pricing more and weakens the case for mid-generation hardware refreshes if consumers perceive diminishing value.
Younger players are shifting toward PC and mobile platforms. That demographic trend threatens long-term console loyalty. Roblox, Minecraft, and Fortnite dominate playtime among younger users, and these titles are either platform-agnostic or perform better on PC and mobile than on traditional consoles. The Sandbox genre surged 36% in playtime during 2025. Roblox alone accounted for 58% of Sandbox engagement and Minecraft contributed 35%. These audiences skew younger, are gender-balanced, and show low overlap with sports and narrative AAA players, the core demographics that sustain PlayStation and Xbox revenue. As these younger users age and gain purchasing power, their platform preferences will reshape market share. Early signals suggest consoles are losing mindshare.
Consumer behavior shifts influencing 2026 share:
- Price elasticity. 38% of consumers would buy fewer full-price games if prices rise. This cohort is critical to day-one sales and hardware attach rates.
- Delayed purchasing. 34% would wait for sales, extending revenue recognition timelines and compressing launch windows for publishers.
- Free-to-play migration. 27% would shift time toward F2P titles. That benefits PC and mobile ecosystems over traditional consoles.
- Younger demographics. PC and mobile gaining share among Gen Z and Gen Alpha. Roblox, Minecraft, and Fortnite function as de facto onboarding platforms.
- Slow audience growth. Console user base expanding at 2.2% CAGR. Platforms now compete for share of existing playtime rather than chasing new players.
Competitive Landscape and 2026 Risks, Disruptors, and Barriers

Sony, Microsoft, and Nintendo remain the dominant incumbents, collectively controlling the vast majority of console hardware sales, software revenue, and ecosystem engagement. Barriers to entry for new competitors are steep. High development and content-creation costs, limited access to exclusive intellectual property, and entrenched brand loyalty among core gamers all combine to protect the existing triopoly. Even well-funded challengers struggle to crack the market without a differentiated value proposition. That reality has kept Google Stadia, Amazon Luna, and other cloud-first platforms from gaining meaningful share.
Yet the competitive landscape isn’t static. Valve’s Steam Deck has demonstrated demand for PC-console hybrids, and an upcoming Valve “Steam Machines” product is positioned as a potential disruptor if priced competitively and widely available. Logitech G and other peripheral manufacturers are exploring cloud-gaming devices that bypass traditional console hardware entirely, using existing PC libraries and subscription services. These entrants don’t need to overtake Sony, Microsoft, or Nintendo to reshape the market. Capturing even 5% share would force pricing adjustments and strategic pivots from the incumbents. And younger demographics drifting toward PC and mobile represent a long-term erosion risk. These users may never develop console brand loyalty.
AI-driven component demand increases hardware cost risks and supply constraints, particularly for Sony and Microsoft, which compete on cutting-edge graphics performance. Top-20 franchise concentration creates revenue stability but limits platform differentiation and makes manufacturers vulnerable to single-title underperformance. If EA Sports FC or NBA 2K engagement softens, PlayStation revenue would face immediate pressure. Xbox’s reliance on Game Pass growth to offset declining microtransaction revenue creates execution risk. The service must keep adding high-value content without compressing per-user profitability below sustainable levels.
Valve’s Potential Entry and Its Impact on 2026 Share
Valve’s upcoming Steam Machines product represents the most credible near-term disruptor to traditional console market share. Unlike prior attempts at PC-console hybrids, Valve now controls a mature digital storefront with deep sales data, a proven subscription service in Steam, and a loyal user base that spans casual and hardcore gamers. If Steam Machines launch with competitive pricing, plug-and-play simplicity, and backward compatibility across the entire Steam library, they’ll appeal directly to PC-curious console users who want flexibility without sacrificing performance. This demographic skews older and more tech-savvy than the typical Nintendo audience, placing Steam Machines in direct competition with PlayStation and Xbox for mid-to-hardcore gamers. Even modest adoption, capturing 3 to 5% of the console market, would represent millions of units and significant revenue redistribution, forcing Sony and Microsoft to speed up cloud-gaming integration and reconsider hardware pricing.
2026–2030 Forecast Scenarios and Data Requirements for Full Market-Share Modeling

The long-range console market forecast projects USD 78 billion in total market size by 2032, tracking a 5.2% compound annual growth rate from the 2025 baseline. Extending this trajectory backward and forward provides a rough framework for 2026–2030 scenarios, but precise modeling requires data elements not included in the current coverage. The most critical missing metrics include regional OEM sales by manufacturer, digital versus physical revenue splits per platform, subscription revenue attributed to Game Pass, PlayStation Plus, and Nintendo Switch Online individually, and installed base figures by console generation. Without these inputs, market-share percentages remain estimates rather than precise allocations.
Engagement coverage spans 37 monitored markets, but revenue data is limited to six Western countries: the United States, United Kingdom, Germany, France, Spain, and Italy. China and India, two of the fastest-growing gaming markets by user count, are excluded from engagement metrics entirely. That creates significant blind spots for global average revenue per user calculations and regional manufacturer share. These gaps are particularly problematic for modeling Nintendo’s performance, as the Switch 2’s appeal in Asia-Pacific and hybrid-handheld demand in emerging markets are central to the company’s 2026 growth thesis.
| Required Metric | Current Status | Gap Severity |
|---|---|---|
| Regional OEM unit sales | Not provided. Only global 2025 share percentages (~45% PS, ~27% Xbox, ~24% Nintendo) | High — prevents region-specific share modeling |
| Digital vs physical revenue split | Noted that digital-only consoles rising. No percentage breakdown by platform | Medium — impacts margin and retail analysis |
| Subscription revenue per platform | Subscription spending growing. No discrete revenue figures for Game Pass, PS Plus, NSO | High — critical for recurring-revenue modeling |
| Installed base by generation | Audience projections to 2028. No install-base split by 9th/10th-gen consoles | Medium — needed for attach-rate and upgrade-cycle forecasts |
| China and India engagement/revenue | Excluded from current coverage | High — largest growth markets by user count. ARPU modeling incomplete |
Forecast scenarios for 2026–2030 depend on assumptions around four key drivers:
- Optimistic scenario. Switch 2 sustains fastest-selling trajectory through 2027. GTA VI and subsequent AAA releases drive hardware attach rates above historical norms. Component costs stabilize by late 2026, enabling competitive pricing. Subscription ARPU grows 8 to 10% annually.
- Baseline scenario. Switch 2 peaks in 2026–2027 then normalizes. GTA VI delivers expected hardware spike but fades by mid-2027. Component costs remain elevated through 2027, compressing margins. Subscription growth continues at 4 to 6% annually.
- Conservative scenario. Switch 2 sales slow faster than expected due to market saturation. GTA VI underperforms purchase-intent surveys. Component shortages delay 10th-gen console launches into 2029. Subscription growth stalls as price-sensitive users churn.
- Disruption-heavy scenario. Valve Steam Machines capture 5 to 7% console share by 2028. Younger demographics accelerate migration to PC and mobile, shrinking console TAM. Tariffs and macro headwinds trigger delayed upgrade cycles and extended console lifecycles.
Final Words
We started with the 2025 baselines — PlayStation ~45%, Xbox ~27%, Nintendo ~24% — and placed them against the long-range CAGR and $78B by 2032 outlook.
Modeling for 2026 folds in Switch 2 momentum, GTA VI’s November 2026 launch, rising subscription spend, and U.S. industry spend near $62.8B. Those forces point to a clear hardware and subscription bump this year.
This console market share report 2026 analysis expects tight competition: Sony still leads on revenue, Microsoft grows via services, and Nintendo benefits from Switch 2 — the market looks healthy.
FAQ
Q: What were console manufacturer market shares in 2025?
The 2025 manufacturer market shares were PlayStation ~45%, Xbox ~27%, and Nintendo ~24%, establishing the baseline for 2026 scenario modeling and competitive comparisons.
Q: What is the expected console market share outlook for 2026?
The 2026 console market outlook expects modest shifts: Sony stays largest, Nintendo gains from Switch 2, Xbox holds or slightly grows, with GTA VI and subscriptions boosting hardware and services demand.
Q: How will GTA VI affect 2026 console sales and subscriptions?
GTA VI’s November 2026 launch is expected to spike hardware, accessory, and subscription demand, increasing console sales and recurring revenue across platforms, especially in North America and Europe.
Q: How will Switch 2 impact 2026 market share?
Switch 2, the fastest-selling US home console after seven months, should accelerate Nintendo’s 2026 share by raising unit sales and younger-user engagement, particularly in handheld-friendly markets.
Q: What role will subscriptions play in 2026?
Subscription growth into 2026 will expand recurring revenue, boost retention, and favor platforms with strong bundling like Game Pass and PlayStation Plus, while nudging ARPU despite falling microtransactions.
Q: What are the main revenue trends shaping 2026?
Key 2026 revenue trends include console game sales making about half of console revenue, microtransactions decline, top-franchise concentration, rising subscriptions, and ARPU pressure from price sensitivity and digital shifts.
Q: How will hardware costs and technology affect 2026 market share?
Rising component costs driven by AI, SSD adoption, cloud integration, and energy-efficient chip trends will influence 2026 share, likely increasing hardware prices and pressuring Sony and Microsoft more than Nintendo.
Q: Which regions will drive 2026 growth?
North America and Europe will remain the largest revenue bases in 2026, while APAC and LATAM will be the fastest-growing regions thanks to younger demographics, broadband gains, and handheld popularity.
Q: How will consumer behavior shape console demand in 2026?
Price sensitivity and shifting playtime will shape 2026 demand: many consumers will buy fewer full-price games, wait for sales, or play more free-to-play titles, favoring platforms with strong F2P catalogs.
Q: What are the top risks and potential disruptors for 2026?
Top 2026 risks include rising hardware costs, youth migration to PC/mobile, heavy reliance on top franchises, and disruptors like Valve’s Steam Machines challenging console install bases and upgrade cycles.
Q: What data gaps must be filled for accurate 2026–2030 modeling?
Key data gaps for 2026-2030 modeling include regional OEM sales, digital versus physical revenue splits, subscription revenue per platform, and installed base by generation, which limit forecast precision.
Q: What is the long-range market forecast to 2032?
The long-range forecast expects the console market to reach about USD 78B by 2032 at a 5.2% CAGR, guiding 2026-2030 scenario planning and investment choices.
