

Retention beats monetization every time — if players don’t come back, nothing else matters.
This post shows the exact metrics and design levers that move D1, D7, and D30 so you stop guessing.
You’ll get a clear framework for cohort and hazard analysis, FTUE fixes, LiveOps and progression tweaks, and which backend issues quietly kill retention.
Read on to learn which levers produce measurable lifts and where to test first.
Practical, testable steps, not vague theory.
Core Retention Metrics Framework for Live Service Games

Live service games rise or fall on one question: do players come back? Retention answers it. The math is simple. Day N retention equals active users on day N divided by installs on day 0, times 100. If 1,000 players install Monday and 150 return the following Monday, your D7 sits at 15%. The industry watches three checkpoints: D1, D7, and D30.
Benchmarks shift by platform. Mobile usually lands between 35 and 40 percent for D1, 10 to 15 percent for D7, and 5 to 10 percent for D30. PC and console push higher—D1 often hits 50 to 60 percent, D7 ranges from 20 to 30 percent, and D30 settles between 10 and 20 percent. These aren’t vanity numbers. Research shows getting players to day 7 can boost 30-day retention by around 60 percent, making D7 the critical turning point for long-term revenue.
Technical problems hurt worse than most teams expect. About 40 percent of players bail after persistent crashes, and each extra second of load time on mobile drops conversions by 20 percent. These are measurable churn triggers, not soft penalties.
To manage retention, track six core metrics:
D1, D7, and D30 retention rates show you where cohorts fall off
Churn rate counts who left and when
DAU and MAU measure audience size and growth
Stickiness ratio (DAU divided by MAU) tells you how intensely people engage
Session length and sessions per day evaluate whether people actually enjoy playing
LTV by cohort links retention gains to revenue
These form the foundation for every retention decision you’ll make. Without baselines, you can’t diagnose what broke or prove a fix worked.
Cohort Analysis and Churn Diagnostics for Live Service Player Behavior

Cohort analysis groups players by shared traits—install date, traffic source, platform, feature exposure—then tracks their survival over time. Instead of “How many players are active today?” you ask “What percent of the March 1st cohort still plays two weeks later?” That shift from totals to time-based survival makes patterns visible.
Churn is retention’s inverse. If 15 percent of a cohort is active on day 7, 85 percent churned. But percentages don’t tell you when or why. For that, you need survival analysis and hazard curves, which reveal exactly when churn spikes. Most games lose the majority of lifetime players within the first 24 hours, making D1 the most important gate to fix.
Using Hazard Rates to Identify Drop-Off Points
Hazard curves plot the probability a player quits on a specific day, given they survived to that point. A spike on day 3 suggests something breaks after the tutorial ends—maybe progression stalls or the first real challenge feels unfair. A spike on day 14 might signal the end of accessible content or broken matchmaking. Map session drops to platform logs—login failures, matchmaking errors, server crashes—and you can separate technical churn (game didn’t work) from content churn (player lost interest). Technical churn you fix with infrastructure. Content churn requires design changes.
| Cohort Type | What It Reveals |
|---|---|
| Install Date | Baseline retention trends and seasonal effects |
| Feature Exposure | Impact of specific design changes or A/B test variants |
| Platform | Device-specific performance or onboarding friction |
| Country | Regional engagement differences and localization quality |
Design Levers That Improve Live Service Player Retention
Retention isn’t built on metrics alone. It’s built on systems that give players reasons to return. Each change should connect to measurable outcomes so you know whether it worked.
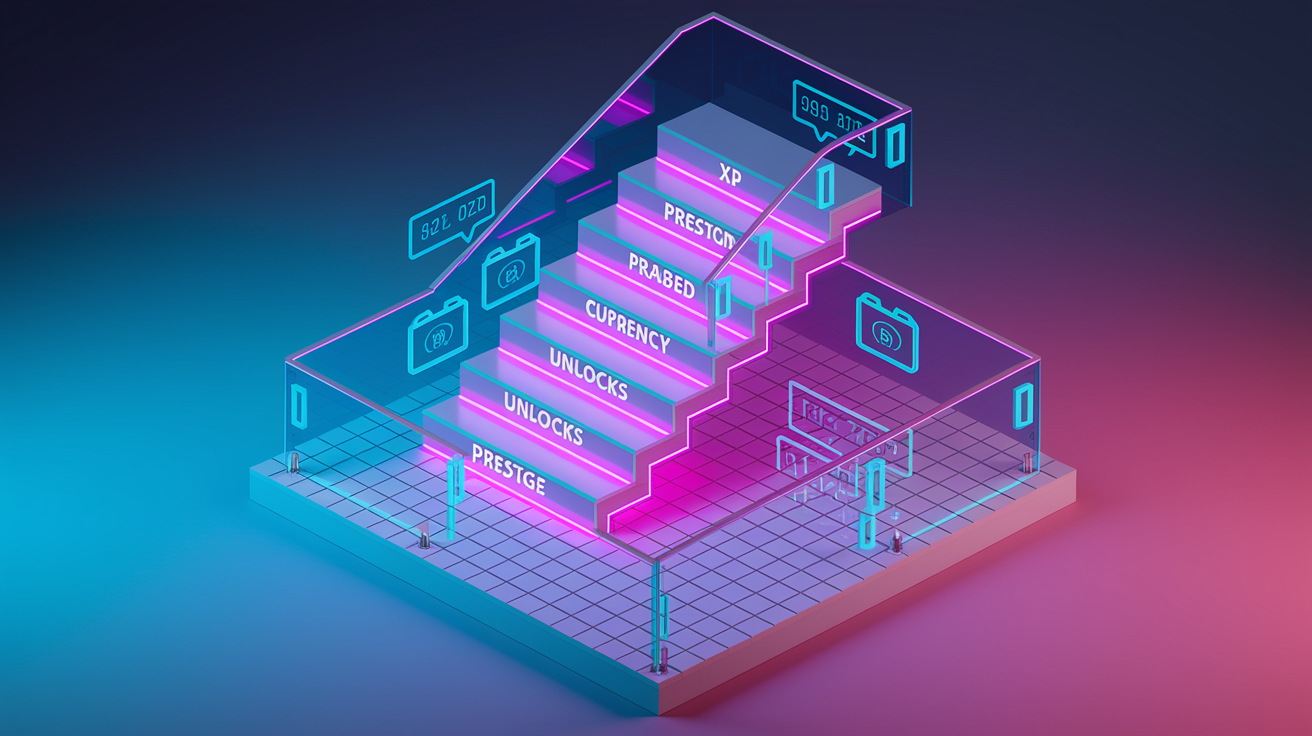
Progression and Meta-Progression Loops
Progression creates forward motion. Short-term loops reward daily play with immediate gains—XP, currency, unlocks. Mid-term loops introduce goals that take days or weeks, like climbing ranked ladders or unlocking prestige tiers. Long-term loops anchor players for months through endgame aspirations, legendary item chases, or seasonal resets that let them start stronger. Roguelikes nail this: temporary runs offer quick dopamine while permanent upgrades create long-term investment. For more on how to structure game mechanics that boost player retention, layering goals across different time horizons works best.
Monitor these to evaluate progression:
- Percent reaching key milestones (level 10, first prestige, endgame unlock)
- Time to milestone and pacing distribution across cohorts
- D7 and D30 retention gaps between players who hit mid-term goals and those who don’t
Reward Timing, Cadence, and Streak Systems
Daily login bonuses, timed chests, and battle passes create rituals. The first hour should include at least one satisfying rare drop to hook new players. Streak systems work because breaking a 7-day login chain feels like wasting effort. Variable reward schedules (sometimes common loot, sometimes legendary) trigger anticipation and keep players checking in. But density matters. Too easy and engagement falls. Too grindy and churn spikes.
Track these to tune rewards:
- Daily login rate and streak continuation percent
- Average rewards claimed per active day
- Correlation between reward participation and D7 lift
LiveOps Events, Limited-Time Modes, and Seasonal Cadence
Limited events create urgency and social energy. A good seasonal reset with exclusive rewards can reactivate dormant cohorts and extend LTV. Events also let you test new mechanics without permanent commitment. If a limited PvP mode gets high participation and retention lift, you can invest in making it permanent.
Monitor these LiveOps KPIs:
- Event participation rate (percent of active players who engage)
- Retention lift during and after the event window
- Post-event stickiness (do participants stay active longer than non-participants?)
Social Systems and Cooperative/Competitive Loops
Guilds, clans, and co-op content anchor retention through social obligation. Players who join a guild and participate in scheduled raids churn less because leaving means letting teammates down. PvP metas that evolve weekly keep competitive players engaged. Streaming integration (leaderboards, tournament modes, spectator tools) extends retention through community recognition.
Track these social signals:
- Retention gap between social users and solo users
- Guild participation rate and average active days per guild member
- Matchmaking fairness metrics (queue abandonment, post-match churn after repeated losses)
Personalization and Adaptive Experiences
Segmented offers, adaptive difficulty, and behavior-driven triggers let you tailor the experience to player type. Young, social players might respond to emotionally framed cosmetic offers while competitive veterans want skill-based challenges. Personalization only works if you act on the data. Build systems that deliver targeted push notifications, in-game messages, or mission bundles based on churn risk or engagement history.
Key KPIs for personalization:
- Conversion and retention lift by segment after targeted interventions
- Churn-risk model precision and recall (how accurately you identify at-risk players)
- Engagement gap between personalized and control experiences
FTUE, Onboarding Metrics, and Early Retention Predictors

The first-time user experience is the most important surface in a live service game. Most lifetime churn happens in the first 24 hours. If onboarding is confusing, slow, or frustrating, players quit before they experience your core loop. Get them to a satisfying moment fast, ideally under 60 seconds of real time.
D1 retention serves as the anchor. If your D1 is weak, everything downstream suffers because you’re bleeding the cohort before players reach the hooks that drive D7 and D30. Every extra second of load time or friction in account creation increases churn risk. Sub-second critical path performance is aspirational but directionally correct—speed matters.
Track these five FTUE KPIs:
- Time to first play from install to first meaningful interaction
- Initial load latency and in-session load times during onboarding
- Tutorial completion rate and drop-off points within the tutorial
- Clarity of first-session goals (measured via survey or qualitative testing)
- Identified friction points (login failures, account-creation errors, unclear UI prompts)
Improving FTUE directly lifts D1, and D1 improvements cascade into D7. Players who survive the first day are exponentially more likely to reach day 7, and reaching day 7 increases the probability of hitting day 30 by around 60 percent. Fix the start and the rest of your retention funnel gets easier.
Technical Stability, Backend Quality, and Their Impact on Retention

Backend infrastructure is a retention lever, not just a technical requirement. Players don’t distinguish between “the game is broken” and “the server is down.” Both result in the same outcome: they quit. Persistent technical issues cause roughly 40 percent of affected players to churn permanently, and a single second of added load time can reduce conversions by 20 percent. The link between backend design and player retention is direct and measurable.
Uptime and latency are table stakes. Aim for 99.9 percent uptime or higher. Instrument p95 and p99 latency metrics, not just averages, because tail latency punishes user experience disproportionately. A backend handling 90-plus live games, processing roughly 7 billion API calls per month, and supporting around $3 million in annual recurring revenue demonstrates the operational scale successful live services require.
Track these essential backend KPIs:
Uptime percentage measured against a 99.9 percent or higher SLO
API latency distribution at p50, p95, and p99 to catch tail-latency spikes
Error rate by endpoint to identify stability regressions quickly
Queue time and matchmaking success rate to ensure fair, fast player pairing
Stability supports LiveOps scalability. Autoscaling infrastructure, remote config systems, and feature flags let you launch events, run A/B tests, and update content without engineering bottlenecks. When your backend is stable and instrumented, you can iterate on retention-driven design levers without risking downtime or degraded performance.
Experimentation, A/B Testing, and Data-Driven Retention Optimization

A/B testing is the most reliable method for proving a design change improved retention. Split your audience into control and treatment groups, expose the treatment group to a new feature or tuning change, and measure the difference in D1, D7, or D30 retention. Statistical significance tells you whether the lift is real or just noise.
When randomized testing isn’t feasible—testing a platform-wide infrastructure change, for example—you can use regression analysis, Facebook Prophet, or Google Causal Impact to estimate causal effects. These tools model what would have happened without the change and compare it to what actually happened. They’re not as clean as A/B tests, but they’re better than guessing.
Designing Retention Experiments
Before you launch an experiment, define three things:
- Sample size based on your baseline retention rate and the minimum detectable lift you care about (use binomial power analysis to calculate required cohort size)
- Primary KPI (usually D7 retention, though D1 and D30 are also common depending on the hypothesis)
- Exposure flags to tag users in the treatment group and ensure clean measurement
Short tests for UI or FTUE tweaks can run one to two weeks to capture D1 impact. Retention-sensitive changes require four to eight weeks to see meaningful D30 effects. On mobile, a 2 to 3 percentage point lift in D7 is material. On PC and console, smaller absolute changes can still be significant because baseline retention is higher.
Evaluating Results and Identifying Lift
| KPI | What Lift Indicates |
|---|---|
| D1 retention | Onboarding or first-session experience improved |
| D7 retention | Mid-term engagement hooks are working |
| Session length | Core loop is more engaging or progression feels better |
Use diagnostic heuristics to guide hypothesis formation. Flat or low D7 retention usually points to onboarding issues or unclear mid-term goals. Declining session length suggests stalled progression or imbalanced rewards. A spike in churn after an update often signals a balance regression, exploit, or matchmaking quality problem.
Once you identify churn-risk signals—decreased play frequency, shorter sessions, fewer social interactions, failed matchmaking attempts—you can build predictive churn models and trigger targeted winback actions. Push notifications, personalized mission bundles, and limited-time offers sent to at-risk players can recover cohorts before they churn permanently.
Player Segmentation, Personalization, and Winback Strategies
Not all players churn for the same reasons, and not all players respond to the same retention levers. Segmentation lets you group players by behavior, demographics, or engagement patterns, then tailor interventions to each segment. Social players care about guilds and co-op content. Competitive players want balanced matchmaking and ranked progression. Casual players need forgiving difficulty curves and clear short-term goals.
The retention gap between social and non-social users is often substantial. Players who join a guild, send friend invites, or participate in co-op activities churn at lower rates because they’ve built social obligation into their play habits. Personalized offers—cosmetics for social players, skill-based challenges for veterans—convert better and lift retention more than one-size-fits-all promotions.
Effective re-engagement depends on timing, relevance, and friction. Use these five approaches:
Push notification timing based on typical play windows and churn-risk flags (send the message when they used to play, not at random)
Targeted offers that match player motivations (discount on a cosmetic for social players, bonus progression resources for grinders)
Mission bundles or comeback quests that give lapsed players a clear, rewarding path back
Guild invites or social nudges from active friends to reactivate dormant players
Content recaps or “what you missed” summaries to reduce the intimidation of returning after a long break
Linking segmentation to retention lift requires clean instrumentation. Tag each player with psychographic and behavioral attributes, track which interventions fire, and measure D7 and D30 retention by segment. If a winback campaign lifts retention for lapsed casual players but not for competitive players, you’ve learned something actionable about motivation and can refine your next test.
LiveOps Content Cadence and Seasonal Retention Planning

Content cadence is the rhythm that keeps live service games alive. Without regular updates, events, and seasonal resets, even the best core loop gets stale. Players finish the available content, hit the progression ceiling, and churn. A good LiveOps calendar prevents that by giving players new reasons to return every week or month.
Participation rate and reward redemption are the primary signals. If only 10 percent of active players engage with a limited event, either the event isn’t appealing or players don’t know it’s happening. Event-driven retention lift shows up in cohort curves: players who participate in an event should show higher D7 and D30 retention than players who don’t. If they don’t, the event might be generating short-term revenue but not building long-term stickiness.
Limited-Time Events and Participation KPIs
Limited modes, seasonal challenges, and rotating content create urgency without permanent commitment. They also let you test new mechanics in a low-risk way. If a limited PvP mode sees high engagement and positive feedback, you can invest in making it permanent. If it flops, you move on without technical debt.
Seasonal Systems and Progression Resets
Seasonal resets with exclusive rewards give veteran players a reason to restart while keeping newcomers competitive. Battle passes layer aspirational long-term goals on top of recurring content. Track these KPIs:
- Season completion rate (percent of players who finish the battle pass or seasonal track)
- Event recurrence (how many players participate in multiple events within a season)
- Post-season stickiness (retention of players who completed the season versus those who didn’t)
Scaling LiveOps requires infrastructure that supports rapid iteration. Autoscaling, remote config systems, and feature flags let non-engineering teams launch events, adjust tuning, and run promotions without code deployments. A backend processing roughly 7 billion monthly API calls demonstrates the throughput needed to support heavy LiveOps activity across a live portfolio.
| Event Type | Retention Effect |
|---|---|
| Limited-Time Mode | Short-term engagement spike; tests new mechanics |
| Seasonal Reset | Reactivates veterans; extends LTV through repeated cycles |
| Battle Pass | Long-term goal structure; monetizes and retains simultaneously |
| Recurring Event | Predictable cadence builds habit; lower production cost |
Roadmap, Prioritization, and Continuous Improvement for Retention

Retention optimization is a continuous loop, not a one-time project. Prioritize fixes using an impact times effort framework. Estimate the incremental retention percentage gain (impact) and the engineering time required (effort), then rank initiatives by the ratio. A change that lifts D7 by 3 percentage points and takes one sprint beats a change that lifts D7 by 1 percentage point and takes three sprints.
Weekly cohort reviews keep your team aligned on what’s working and what’s breaking. Track negative signals in real time: sudden drops in D1 or D7, spikes in error rates, rising complaint volumes, or exploit reports. When a signal fires, diagnose the root cause quickly and decide whether to roll back, hotfix, or iterate forward.
The continuous improvement loop has four steps:
- Instrument the events and KPIs that matter: session start/end, tutorial completion, milestone reached, purchase attempt, match result, churn-risk flags.
- Segment cohorts by install date, feature exposure, platform, and acquisition source so you can isolate the effect of each change.
- Diagnose top drop-off points using retention curves, hazard rates, and funnel analysis, then map each drop-off to a design lever or technical issue.
- Test the highest-impact fixes with A/B experiments, measure D7 or D30 lift, and iterate based on results.
Operational tempo matters. Run weekly retention reviews with product, analytics, and engineering. Adjust your monthly roadmap based on recent cohort performance and experiment results. Treat retention as the operational heartbeat of your live service, not a vanity metric you check once a quarter.
Final Words
Measure D1/D7/D30, DAU/MAU, churn, session length and LTV. Add cohort curves, churn formulas, and hazard rates to spot early drop-off windows and platform differences like mobile vs PC/console.
Then act: tighten FTUE, shorten load times, tune progression loops, time LiveOps events, and build social hooks. Keep backend uptime and latency high so technical churn stays low.
This post mapped the analytics, diagnostics, and practical live service player retention metrics and design levers teams need to test and scale. Start small, run quick experiments, and iterate. Steady wins add up.
FAQ
Q: What do D1, D7, and D30 retention measure?
A: D1, D7, and D30 retention measure the percentage of players who return one day, seven days, and thirty days after install, showing short-, mid-, and long-term product survival and onboarding health.
Q: What are typical retention benchmarks for mobile and PC/console?
A: Typical retention benchmarks for mobile and PC/console are: mobile D1 35-40%, D7 10-15%, D30 5-10%; PC/console D1 50-60%, D7 20-30%, D30 10-20%. Use these as rough targets.
Q: How do you calculate retention and churn rate?
A: Retention is calculated as returning users divided by total users in the period, and churn rate is churned users divided by total users, or simply one minus retention for the same period.
Q: What key metrics should live service teams track for retention?
A: Key metrics to track are D1, D7, D30 retention, churn rate, DAU/MAU, stickiness ratio, session length, and LTV, which together show engagement, growth, and monetization health.
Q: What is cohort analysis and why use it?
A: Cohort analysis groups players by install date or behavior to reveal retention curves, acquisition quality, onboarding problems, and where content or technical fixes will improve player survival.
Q: How do hazard rates help identify player drop-off points?
A: Hazard rates show the likelihood of churn at each time slice, helping spot high-risk windows like the first 24 hours so you can prioritize onboarding or mid-game fixes.
Q: How much does technical instability affect retention?
A: Technical instability can cause major churn: persistent backend issues risk about 40% player loss, and each additional second of load time can cut conversion by roughly 20%.
Q: Which FTUE metrics predict early retention?
A: FTUE predictors include time-to-first-play, load latency, tutorial completion, clarity of first-session goals, and obvious friction points, all of which directly influence D1 and early survival.
Q: How long should retention-focused A/B tests run?
A: Retention A/B tests usually run 1–2 weeks for D1 signals and 4–8 weeks for D30 outcomes to reach statistical significance while keeping exposure flags stable.
Q: What design levers most improve player retention?
A: Key design levers that improve retention are progression loops, reward cadence, LiveOps events, social systems, and personalization, measured by participation, retention lift, and session or monetization metrics.
Q: How should teams prioritize retention work and iterate?
A: Teams should prioritize retention work using an impact-by-effort lens, run weekly cohort reviews, and follow instrument, segment, diagnose, test, iterate for continuous improvement.
Q: What re-engagement strategies work for winback campaigns?
A: Effective winback strategies include timed push messages, targeted offers, mission bundles, guild invites, and content recaps, each tied to segmentation and measurable reactivation KPIs.
