

Is mobile gacha finally hitting a wall despite billions in revenue?
Japan alone pulled in over $11 billion in yearly in-app sales, yet many titles face steady spending declines.
The usual culprits are falling user acquisition, banner fatigue, poor price-to-value, heavy whale dependence, and tougher household budgets.
This post analyzes those causes and gives developers clear, testable recovery strategies, including better monetization per active user, retention fixes, price and bundle changes, and regional rebalancing.
You’ll get practical steps and a three- to six-month roadmap you can start measuring right away.
Mobile Gacha Spending Decline Analysis and Recovery Strategies for Developers
The Scale and Mechanics of Revenue Pressure in Mobile Gacha

Mobile gacha games pulled in some of the highest per-user revenue figures in the industry through 2024. Japan alone recorded over $11 billion in annual in-app purchase revenue during the August 2024 to July 2025 window, with 628 million downloads. But here’s the thing: despite these top-line numbers, the market’s been shrinking compared to 2020 COVID-era highs. A lot of titles are dealing with sustained revenue decline. The culprits? Falling user acquisition, player fatigue, and way too much dependency on a small handful of high-spending whales.
The gacha monetization model creates this tension. You’ve got time-limited banners with low featured-unit odds (usually 1% per pull), pity systems that guarantee drops after a set number of rolls (often 60 to 120 pulls), and scarcity windows of two to four weeks before content rotates out or disappears for months. These mechanics generate enormous revenue for top performers. Genshin Impact reported roughly $1.4 billion in 2021, while PUBG Mobile and Honor of Kings each recorded around $2.8 billion the same year. But the same systems create vulnerability. When players feel overwhelmed by relentless banner cycles, frustrated by low odds even with pity in place, or priced out by economic conditions, spending drops sharply and churn accelerates.
Typical gacha titles see paying conversion rates of 2% to 5% of daily active users. A decline from 3% to 2% conversion cuts gross revenue by roughly one-third. Retention benchmarks sit at 30% to 40% on day one, 8% to 20% on day seven, and 3% to 8% by day thirty. A five-percentage-point drop in day-seven retention, from 18% down to 13%, can reduce 90-day lifetime value by 10% to 25%. And when the top 1% of players commonly generate 40% to 70% of all revenue, losing ten to twenty whales in a mid-size title can trigger monthly revenue declines in the double digits.
This revenue concentration creates fragility. In Japan, nearly 70% of gacha revenue originates domestically even though more than 80% of downloads come from overseas markets. You’ve got strong monetization among domestic whales but undermonetized international install bases. A financial survey earlier this year found that 18.8% of people in their twenties reported spending so much on in-game purchases at least once that they couldn’t cover living expenses. That signals both the intensity of engagement and the social and regulatory risk building around these mechanics.
The current environment? Market saturation. Over half of top-grossing charts feature repeat gacha formulas, and declining organic discovery reduces year-over-year in-app purchase growth by 5% to 15% for average titles. Existing hit titles retain players and sustain spending through refined live-ops and deep content libraries, but new launches struggle to acquire users and convert them into payers. Industry sentiment in Japan described the situation as a “sinking Titanic” with only a few seats remaining. Concentrated opportunity among established franchises, steep barriers for newcomers.
Recovery requires a structured approach that addresses the root causes: acquisition pressure, monetization efficiency, retention mechanics, content depth, pricing fairness, and geographic revenue balance, all while maintaining the core appeal of gacha systems. The rest of this analysis provides measurable tactics, industry benchmarks, testing frameworks, and implementation roadmaps designed to reverse spending declines over three to six months.
Primary Causes of Mobile Gacha Spending Decline
Declining User Acquisition and Market Saturation
New-user acquisition has fallen significantly from 2020 peaks. Japan’s 628 million annual downloads during the August 2024 to July 2025 window represent a contraction in the install base that directly constrains revenue growth, especially for titles with strong but aging player populations. Organic discovery has become harder as more than 50% of top-grossing positions are occupied by gacha titles using similar mechanics, character-collection loops, and time-limited banner calendars. This saturation reduces the marginal return on user-acquisition spend and makes it harder for new titles to break through without significant paid media budgets.
When fewer new players enter the funnel and existing players age into lower engagement or churn, the revenue base narrows. Titles that rely heavily on banner-driven monetization see immediate pressure because each limited event must now convert a smaller, more saturated audience. The cost to acquire a new paying user climbs while the expected lifetime value from that user may stay flat or decline if competitive alternatives and player fatigue are rising at the same time.
The historical playbook of scaling revenue by scaling installs no longer works as efficiently. Recovery strategies must shift focus from install volume to monetization yield per active user, retention improvements that extend player lifetime, and regional strategies that unlock revenue from the large overseas download volumes that currently undermonetize.
Player Fatigue and Repetitive Banner Cycles
Roughly 30% of churn reasons in midcore gacha titles tie back to “no new must-have content” per season, and banner or character rehash frequency under six weeks increases fatigue risk. The core gacha loop (new limited banner, grind or spend to reach pity, repeat) loses psychological impact when players recognize the pattern and predict future cycles. When a new banner feels like a reskin of prior mechanics or character archetypes, the urgency to spend diminishes even if the odds and pity systems remain unchanged.
Fatigue manifests in several measurable ways. Session frequency drops, average session length shortens, login streaks break, and participation in limited events declines. Players who previously spent to secure every featured character begin skipping banners they perceive as filler or saving premium currency for anticipated future releases. This behavior reduces short-term revenue and increases volatility, because spending becomes more concentrated around a few “must-pull” events per year rather than distributed across a steady live-ops calendar.
The problem gets worse when live-ops teams rely on banner velocity to hit monthly revenue targets. Stacking multiple high-value banners in a short window forces players to choose between desired characters. That can drive spending spikes but also accelerates burnout and resentment. Players who feel pressured into repeated spend cycles without meaningful gameplay or narrative progression are more likely to churn permanently rather than return after a break.
Poor Perceived Value and Pricing Mismatch
Common mid-tier pack price points of $4.99 to $9.99 often underdeliver perceived value when the in-game economy requires 150 to 400 premium currency per single pull and bundles don’t scale discount rates proportionally. When a player calculates that a $9.99 pack buys only a few pulls toward a 60- or 90-pull pity threshold, the psychological gap between price and reward feels punitive, especially when the base odds for a featured unit sit at 1%.
Pricing mismatch reduces conversion among moderate spenders who are willing to pay but not at whale-level budgets. These players represent a critical revenue segment (historically 20% to 40% of incremental revenue growth when properly monetized), but many gacha titles focus bundle design and offers almost exclusively on either minimal spenders (starter packs under $5) or whales (bundles above $50). The mid-tier is neglected, leaving revenue on the table and limiting the diversity of the paying user base.
When players perceive poor value, they delay purchases, wait for better promotional offers, or stop spending altogether. Refund rates and support complaints increase, and negative app-store reviews cite “expensive” or “unfair” pricing. These signals are early warnings that the monetization model is misaligned with the player base’s willingness to pay and risk tolerance.
Macroeconomic Constraints and Discretionary Spend Reduction
During economic contraction or inflation periods, average spend per paying user can fall 10% to 30% month-over-month without any product changes. Mobile gacha spending is discretionary and competes with other entertainment, subscription services, and essential expenses. When household budgets tighten, players cut back on premium-currency purchases, skip limited banners, or shift to free-to-play strategies that rely on grinding and saving in-game currency.
This effect hits mid-tier spenders hardest. Whales with high disposable income often continue spending at prior levels, while non-payers remain non-payers. The middle cohort (players who previously spent $10 to $50 per month) reduces frequency or drops spending entirely. Because this group is larger in absolute numbers than the whale segment, the aggregate revenue impact can be severe even if whale spend remains stable.
Macroeconomic pressure also increases sensitivity to perceived fairness and value. Players who previously tolerated low odds or long grinds become more critical when their budgets are constrained. Any pricing change, banner adjustment, or reduction in free currency is scrutinized more heavily, and negative sentiment spreads faster through social channels and community forums.
Heavy Revenue Concentration and Whale Dependency
When the top 1% of players generate 40% to 70% of revenue, the business model is inherently volatile. Losing a handful of high-spend accounts due to churn, competitive games, or life changes can trigger double-digit monthly revenue declines. This concentration creates a reinforcing cycle: live-ops and content are designed to retain and monetize whales, which can alienate lower-spending players and shrink the overall active user base, which in turn increases dependency on the remaining whales.
Revenue concentration also limits the effectiveness of broad monetization experiments. Pricing tests, new bundle tiers, or retention mechanics that appeal to moderate spenders may have minimal impact on top-line revenue if whales continue spending at prior levels regardless of changes. This can lead teams to underinvest in mid-tier monetization and focus exclusively on high-ticket offers, further narrowing the revenue base.
The risk compounds when whales feel taken for granted or perceive that the game is designed solely to extract maximum spend from them. Transparent changes to gacha rates, perceived predatory bundling, or removal of pity systems can accelerate whale churn and generate negative publicity that deters new players from even installing the game.
Regulatory and Trust Issues
By 2022 through 2024, at least five jurisdictions tightened rules on loot-box and gacha disclosures, requiring transparent odds, age gating, and in some cases spending caps or parental controls. Non-compliance can result in app-store removals, fines, or immediate revenue drops of 5% to 25% in affected markets. Even when compliance is maintained, regulatory scrutiny increases operational costs and constrains design flexibility.
Beyond formal regulation, player trust is fragile. Opaque changes to gacha rates, undisclosed adjustments to pity systems, or bundles that appear to manipulate scarcity can trigger community backlash, review-bombing, and viral social-media campaigns. These events damage retention, reduce word-of-mouth acquisition, and create lasting reputational risk that affects future title launches and studio brand equity.
Trust issues are especially acute when players discover that advertised odds don’t match experienced outcomes, even when statistically valid variance is the cause. The psychological impact of “bad luck” in a gambling-like system can feel like deception, and rebuilding trust after a perceived breach requires extended transparency, compensatory rewards, and consistent communication, all of which divert resources from revenue-generating activities.
Industry Benchmarks and Numeric KPIs to Monitor
Core Retention and Engagement Metrics
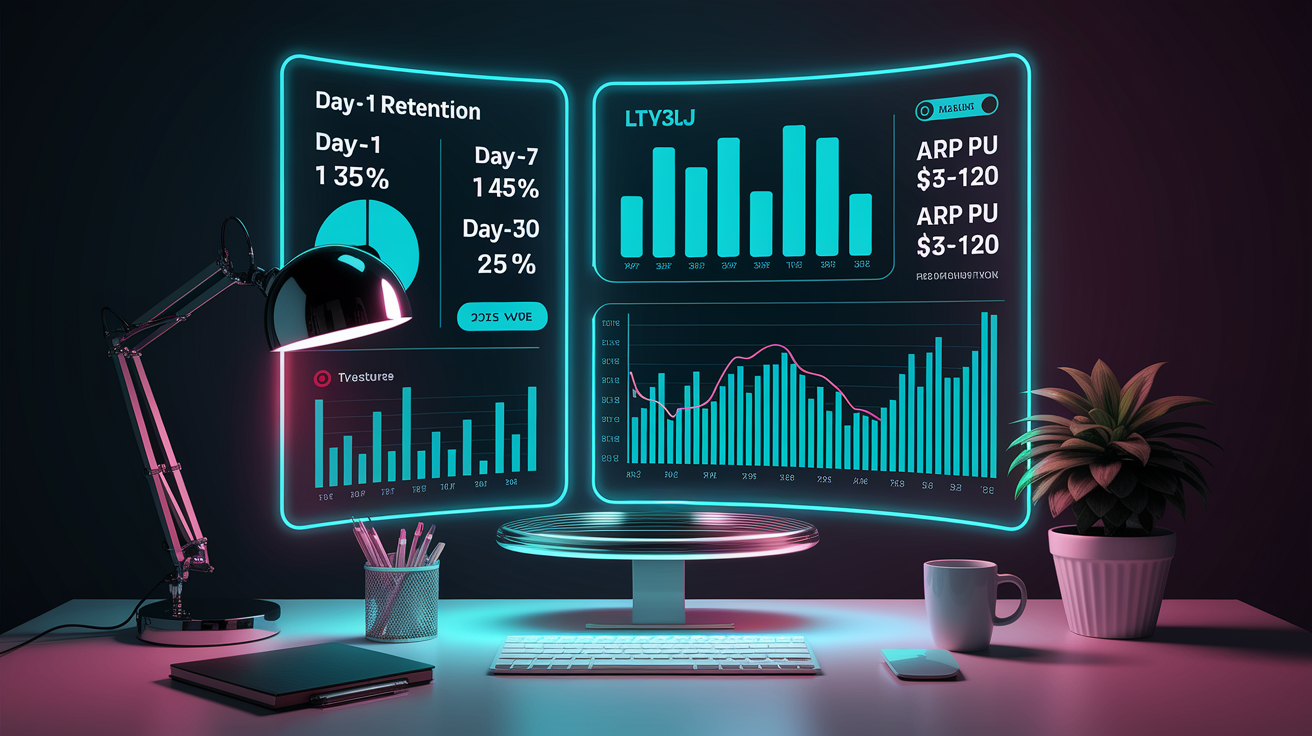
Day-one retention typically ranges from 30% to 40% for midcore gacha titles. This metric captures the share of new installs who return the day after first session and is heavily influenced by onboarding quality, early reward pacing, and clarity of progression systems. A 5-percentage-point drop in day-one retention, from 35% to 30%, means that for every 1,000 new installs, 50 fewer players re-engage. That compounds into significant lifetime-value losses downstream.
Day-seven retention sits between 8% and 20%, with higher-performing titles clustering near the top of that range. This window is where the initial novelty wears off and players decide whether the core loop and content depth justify continued engagement. Retention at this stage is sensitive to live-ops cadence, event accessibility, and the perceived fairness of progression. A 5-percentage-point absolute decline in day-seven retention, such as moving from 18% to 13%, typically reduces 90-day lifetime value by 10% to 25% because fewer players reach monetization windows and participate in mid-term events.
Day-thirty retention ranges from 3% to 8%. Players who reach this milestone are significantly more likely to convert into payers and participate in recurring monetization loops. Improving day-thirty retention by even 2 to 3 percentage points can yield disproportionate revenue impact because this cohort represents the engaged core who will see multiple banner cycles, seasonal content updates, and cross-promotion opportunities.
DAU to MAU ratio, which measures daily active users as a percentage of monthly active users, should target 25% to 40% for midcore gacha. Lower ratios indicate infrequent engagement, which reduces exposure to limited-time offers and event monetization. Higher ratios suggest sticky daily habits but can also signal feature fatigue if session length or session frequency plateaus despite high DAU/MAU.
Session frequency and session length are complementary engagement signals. Midcore gacha titles with strong retention typically see 2 to 4 sessions per day per active user, with average session lengths of 10 to 30 minutes. Declining session frequency often precedes churn, while declining session length can indicate feature burnout or lack of meaningful short-session activities.
Monetization and Revenue Metrics
Paying conversion rate (the percentage of daily or monthly active users who make at least one purchase) commonly sits between 2.0% and 5.0%. A decline from 3.0% to 2.0% reduces gross revenue by roughly one-third, assuming ARPPU remains constant. Conversion rate is influenced by onboarding monetization (starter packs, first-time buyer offers), event-driven urgency (limited banners, time-gated rewards), and perceived value (bundle pricing, pity accessibility).
Average revenue per paying user (ARPPU) for gacha titles ranges from $25 to $120 per month, depending on title maturity, content cadence, and player demographics. ARPPU is a function of purchase frequency, average basket size, and the distribution of spending across low, mid, and high tiers. Increasing ARPPU by 10% to 20% through better bundle value, targeted offers, or pity-acceleration options is a common recovery target and can offset conversion-rate declines.
Average revenue per daily active user (ARPDAU) typically falls between $0.02 and $0.20. This blended metric captures both conversion rate and ARPPU and is the clearest single indicator of monetization health. Titles below $0.05 ARPDAU struggle to sustain live-ops investment and are vulnerable to revenue shocks. Titles above $0.10 have headroom to experiment with pricing, retention mechanics, and content depth without immediate existential pressure.
Lifetime value at 30 days (LTV30) and 90 days (LTV90) should be tracked by cohort and acquisition channel. LTV30 captures early monetization from onboarding offers and first banner cycles, while LTV90 reflects sustained engagement and participation in multiple live-ops events. Recovery strategies should aim to increase LTV30 by 10% within 90 days through onboarding and pricing optimizations, and LTV90 by 15% to 25% through retention mechanics and content roadmap improvements.
Revenue concentration is measured by tracking the share of total revenue generated by the top 0.1%, top 1%, and top 5% of spenders. When the top 1% generates more than 60% of revenue, the business is highly vulnerable to whale churn. Recovery plans should include tactics to reduce this dependency to 50% or lower by strengthening mid-tier monetization through subscriptions, event passes, and mid-range bundles.
Acquisition and Efficiency Metrics
Customer acquisition cost (CAC) and lifetime value must be tracked together to ensure sustainable growth. A healthy LTV-to-CAC ratio is 3:1 or higher, meaning that the expected lifetime value of an acquired user is at least three times the cost to acquire them. Ratios below 2:1 indicate unprofitable acquisition or undermonetized users. Payback period (the number of days required for cumulative revenue from a cohort to exceed acquisition cost) should target 30 to 90 days for gacha titles with strong early monetization.
Organic versus paid install mix influences both CAC and LTV. Organic installs typically have higher retention and slightly higher LTV because they reflect genuine interest rather than incentivized or mistargeted paid media. A declining share of organic installs often signals reduced word-of-mouth growth and competitive pressure, both of which correlate with revenue decline.
Behavioral and Risk Metrics
Purchase frequency (the average number of transactions per paying user per month) indicates engagement with monetization loops. Healthy gacha titles see 2 to 5 purchases per payer per month, often aligned with weekly or bi-weekly banner rotations. Declining purchase frequency suggests that players are becoming more selective, waiting for better offers, or losing urgency around limited content.
Average basket size (the average revenue per transaction) typically ranges from $5 to $50 depending on bundle tiers and player segmentation. Increasing basket size through 10-pull discounts, bonus currency on larger packs, or bundled premium items can lift ARPPU without requiring more frequent purchases.
Refund rate and support ticket volume are early-warning indicators of monetization friction. Elevated refund rates, especially around banner launches or pricing changes, signal perceived unfairness or buyer’s remorse. Support tickets related to gacha odds, pity systems, or pricing confusion indicate poor transparency or communication.
Net Promoter Score (NPS) and app-store review sentiment should be monitored before and after major monetization changes. A 10-point drop in NPS or a shift from 4.5-star to 4.0-star average rating often precedes measurable churn and revenue decline. Social-media sentiment tracking, including keyword frequency around “unfair,” “expensive,” or “pay-to-win,” provides qualitative context to quantitative KPIs.
Whale churn rate should be tracked separately from overall churn. Losing 10% to 20% of top spenders in a single month can trigger revenue declines of 5% to 15% or more, depending on concentration. Monitoring whale engagement through VIP-tier participation, event leaderboard activity, and direct communication channels allows early intervention before churn occurs.
Product and UX Fixes That Deliver Measurable Revenue Recovery
Introducing or Tuning Pity and Guarantee Systems
Pity systems are the most direct tool for balancing scarcity and accessibility in gacha mechanics. Common industry pity windows range from 60 to 120 pulls for high-rarity items, with 90 pulls being a frequent midpoint. When pity thresholds are too high relative to free currency income and bundle pricing, players perceive the system as punitive rather than protective. Reducing pity from 90 pulls to 60, for example, can increase conversion by making the guaranteed outcome feel more attainable and reducing the psychological barrier to starting a spending cycle.
Testing pity adjustments requires careful segmentation. Roll out a reduced pity threshold to a subset of players, measure conversion rate, ARPPU, purchase frequency, and LTV30 against a control group, and validate that the revenue lift from increased spending frequency offsets any reduction in total pulls per paying user. In practice, many titles find that reducing pity increases the number of paying users and total transactions while maintaining or slightly increasing overall revenue because more players reach the guarantee and feel rewarded rather than exploited.
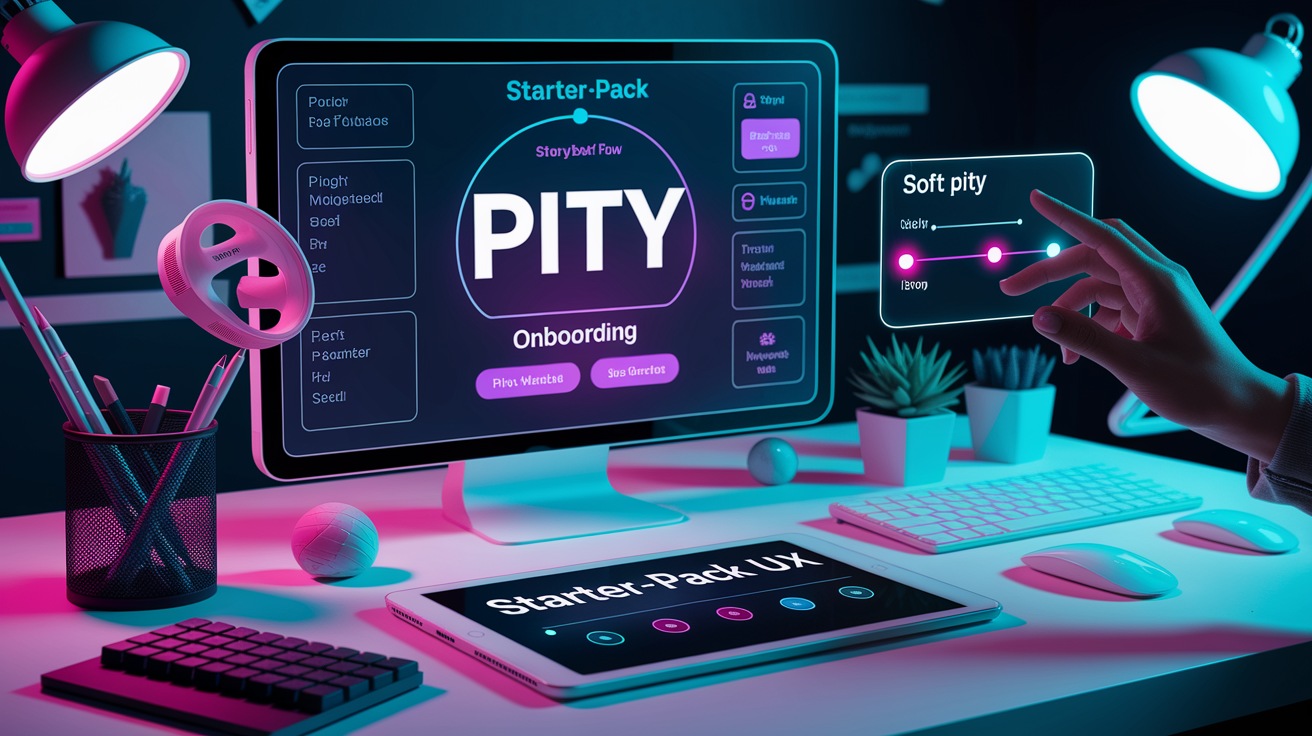
Soft pity, which increases drop rates incrementally as players approach the hard pity threshold, can smooth the frustration curve and deliver small wins that keep engagement high. For example, increasing featured-unit odds from 1.0% to 1.5% after pull 50 and to 2.5% after pull 70 creates intermediate milestones and reduces the perception that pity is the only path to success. Soft pity is especially effective when communicated transparently in-game, as it builds trust and encourages continued pulling.
Guaranteed bonus systems (such as awarding a consolation premium item every 10 pulls even when the featured unit doesn’t drop) provide steady positive reinforcement. This mechanic reduces the variance in player experience and makes every pull feel incrementally valuable, which can increase purchase frequency and reduce post-pull buyer’s remorse. Expect retention bumps of 3 to 8 percentage points and reduced refund or complaint rates when pity systems are perceived as fair and transparent.
Improving Onboarding to Monetize Faster
The first-time user experience is the highest-leverage opportunity for monetization improvement. Adding a first-time buyer pack priced at $0.99 to $4.99 with 3- to 7-day exclusive availability raises day-seven conversion by 1 to 3 percentage points. This pack should deliver immediate value: premium currency equivalent to 5 to 15 pulls, a guaranteed high-rarity character or item, and bonus stamina or progression boosters, so that the player feels the purchase impact within the first session.
Onboarding monetization works because new players have high engagement, low buyer’s remorse, and minimal comparison to prior spending in the title. A well-designed starter pack converts hesitant free-to-play users into payers early, which increases the likelihood of subsequent purchases. Players who make any purchase in the first week are 3 to 5 times more likely to remain active and continue spending over 90 days than players who never spend.
The onboarding funnel should surface the starter pack offer at natural decision points: after the tutorial gacha simulation, after the first story milestone, or when the player accesses the premium shop for the first time. Visual prominence, countdown timers that emphasize limited availability, and clear value communication (“90% more currency than standard packs”) all increase conversion. A/B test pack pricing at $0.99, $2.99, and $4.99 to identify the price point that maximizes total revenue rather than conversion alone, since higher-priced packs often yield better revenue despite slightly lower conversion.
Extending onboarding monetization beyond the first purchase (such as offering a second-tier pack at $9.99 after the starter pack is claimed) captures players who are ready to spend more but don’t yet want to commit to $50 or $100 bundles. This tiered approach builds a monetization ladder that guides players from low-commitment trial to habitual spending without overwhelming them with choices or high prices at the outset.
Rebalancing Single-Pull vs. Multi-Pull Value
Offering a 10-pull discount of 8% to 20% off single-pull pricing and a guaranteed bonus item or increased odds on the 10th pull encourages players to batch their spending and increases basket size. Typical uplift in spend per purchase ranges from 15% to 40% when 10-pull bundles are introduced or improved, because players perceive better value and prefer the convenience of a single transaction over multiple small purchases.
The 10-pull mechanic also creates a psychological anchor. When players see that a 10-pull costs 2,700 premium currency compared to 3,000 for ten individual pulls, the discount feels meaningful even though the absolute savings are modest. Adding a guarantee (such as at least one rare-tier item per 10-pull) further reduces perceived risk and makes the batch purchase feel safer than spreading pulls across multiple sessions.
Testing 10-pull value requires tracking not only total revenue but also purchase frequency and player retention. If 10-pull discounts cannibalize single pulls without increasing total currency purchased, the net revenue impact may be neutral or negative. However, in most cases, the convenience and perceived value of 10-pull bundles increase total currency sales and reduce purchase friction, leading to net positive revenue outcomes. Monitor ARPPU, purchase frequency, and revenue per transaction over a 4- to 8-week window to validate the lift.
Regional pricing for 10-pull bundles can unlock revenue from overseas markets. When 80% of downloads come from outside the domestic market but only 30% of revenue does, localized pricing that adjusts bundle costs to regional purchasing power can significantly increase conversion and total revenue. A 10-pull bundle priced at $25 in one market might convert better at $15 or $18 in another, depending on median income and competitive pricing for similar entertainment products.
Adding Recurring Subscriptions and Season Passes
Small recurring subscriptions priced at $3.99 to $7.99 per month that grant daily premium currency, stamina refills, and small guaranteed drops convert 0.5% to 3% of active users and increase monthly ARPDAU by $0.02 to $0.10. Subscriptions provide predictable revenue, improve retention by creating daily login incentives, and reduce the pressure on banner-driven monetization by diversifying revenue streams.
Subscription design should balance accessibility and exclusivity. A $4.99 monthly pass that delivers 150 premium currency per day, one stamina refill, and a small daily guaranteed reward provides clear ongoing value without cannibalizing banner spending. Players who subscribe are often distinct from whales. They value steady progression and convenience over high-variance gacha pulls, so subscriptions expand the revenue base rather than merely shifting spending from one mechanic to another.
Season passes, which combine free and paid progression tracks tied to limited-time events or content updates, offer another recurring monetization layer. A $9.99 season pass that unlocks premium rewards at milestone checkpoints over 30 to 60 days converts 1% to 5% of active players and generates incremental revenue while encouraging sustained engagement. Season-pass holders typically show 10% to 20% higher retention over the pass duration because they have a financial stake in completing the track.
Testing subscription and season-pass adoption requires clear communication of value and a low-friction purchase flow. Offer a discounted trial (e.g., first month at $1.99) to lower the barrier to entry, then track renewal rates, average subscription tenure, and incremental revenue lift compared to control cohorts. Expect 40% to 60% renewal rates after the first month for well-designed subscription products, with renewal rates stabilizing around 50% to 70% in subsequent months as less-engaged subscribers churn out.
Transparent Odds Display and Progress Tracking
Surfacing pity progress, soft-pity rates, and transparent odds in the UI builds trust and reduces the perception of manipulation. Displaying “35 pulls until guaranteed featured unit” and “Current drop rate: 1.2% (increased)” directly in the gacha interface makes the system feel fair and predictable, which can increase willingness to spend among risk-averse players.
Transparency also reduces support burden and refund rates. When players understand exactly how pity works and can see their progress in real time, complaints about “rigged” odds or hidden mechanics decline. This allows community management and customer-support teams to focus on higher-value interactions rather than repeatedly explaining gacha mechanics.
Experiment with full odds disclosure versus control by segmenting a portion of the player base and measuring retention, conversion, and sentiment. In most cases, transparency either has no negative impact or produces small positive lifts in retention and conversion, especially among players who are already familiar with gacha mechanics and appreciate clear communication.
Regulatory compliance is an additional benefit. Many jurisdictions now require odds disclosure, and proactively implementing transparent UI reduces the risk of app-store removal or fines. Building transparency into the core product experience also future-proofs the title against tightening regulation and allows the team to position the game as player-friendly in marketing and community communication.
Pricing and Monetization Refinements
Tiered Bundle Strategy and Price Anchoring
A well-structured bundle tier system offers price points at $0.99, $4.99, $9.99, $24.99, $49.99, and $99.99 to capture the full spectrum of willingness to pay. Each tier should deliver progressively better value per dollar to incentivize higher spending, but the absolute value gap between tiers must feel meaningful enough to justify the price jump.
The $0.99 tier is a psychological entry point designed to convert hesitant free-to-play users. It should deliver a small but immediate reward: enough premium currency for 1 to 3 pulls, a guaranteed low-rarity item, or a useful consumable. The goal isn’t high revenue but rather breaking the psychological barrier of “I have never spent in this game.” Players who spend $0.99 are significantly more likely to make future purchases than players who never spend at all.
Mid-tier bundles at $4.99 and $9.99 target moderate spenders and should deliver clear value: premium currency for 10 to 25 pulls, bonus stamina, and a guaranteed rare or premium item. This tier historically accounts for 20% to 40% of revenue growth when properly designed but is often neglected in favor of high-ticket whale bundles. Testing bundle contents, bonus percentages, and limited-time offers at these price points can unlock substantial incremental revenue from players who will never spend $50 but are willing to spend $5 to $10 per week or month.
High-ticket bundles at $49.99 and $99.99 are designed for whales and should offer maximum value per dollar along with exclusive items or guaranteed high-rarity pulls. These bundles often include time-limited or one-time purchase restrictions to create urgency and scarcity. Monitor revenue concentration from these tiers and avoid over-reliance on $99.99 bundles, as this increases vulnerability to whale churn.
Price anchoring works by presenting the highest-value tier first or displaying the cost-per-pull comparison across tiers. For example, showing that the $99.99 bundle delivers premium currency at $0.08 per pull while the $4.99 bundle costs $0.15 per pull makes the high-ticket offer feel like a better deal and can shift some mid-tier spenders up to higher-price bundles. But anchoring must be balanced against accessibility. If the cheapest meaningful bundle feels out of reach, overall conversion suffers.
Limited-Time and Event-Specific Offers
Time-limited bundles tied to specific banners, events, or holidays convert 2% to 8% per targeted cohort and generate incremental revenue on top of standard monetization. These offers work because they combine scarcity (only available for 48 to 72 hours), exclusivity (unique items or bonus currency not available in permanent shop), and alignment with high-engagement moments (new banner launch, story update, competitive season).
Event-specific offers should be designed to accelerate progress within the event rather than bypass it entirely. For example, a $9.99 bundle that grants event currency, stamina refills, and a guaranteed event reward at a mid-tier milestone encourages players to engage with the event content while monetizing their urgency. This approach preserves the perceived fairness of the event and avoids the backlash that can occur when pay-to-win shortcuts feel exploitative.
Testing limited-time offers requires careful control groups and pre-specified statistical power. For conversion metrics with a baseline of 2%, detecting a 20% relative lift (from 2.0% to 2.4%) at 95% confidence typically requires tens of thousands of users per variant. Smaller tests focused on UI presentation, messaging, or timer placement can use 5,000 to 10,000 DAU per variant when testing for larger effect sizes.
Offer fatigue is a risk when limited-time bundles appear too frequently. Players who see a “last chance” offer every week learn to ignore the scarcity framing, and conversion rates decline over time. Establish a cadence of one major limited offer per significant content update (every 2 to 4 weeks) and reserve daily or weekly offers for lower-value, lower-urgency items to preserve the psychological impact of true scarcity.
Personalized and Segmented Offers
Personalized offers based on player segmentation (non-spenders, low spenders, mid spenders, whales) deliver higher conversion and better revenue per impression than one-size-fits-all bundles. Segmentation can be based on cumulative spend, days since last purchase, progression stage, or engagement level. For example, a player who has never spent might see a $0.99 starter pack, while a player who spent $50 last month might see a $24.99 exclusive bundle with premium items.
Dynamic offer personalization requires robust analytics infrastructure and A/B testing frameworks to avoid cannibalizing higher-value purchases. If a whale is shown a $4.99 offer instead of a $99.99 offer due to poor targeting, the revenue loss can be significant. Establish clear rules for offer priority (new-player offers first, then lapsed-payer re-engagement, then regular rotation for active payers) and validate targeting accuracy before full rollout.
Re-engagement offers for lapsed payers (players who previously spent but haven’t purchased in 30 to 90 days) often convert at 3% to 10% and deliver positive ROI if the cost to surface the offer (push notification, in-game pop-up) is under 20% of expected incremental revenue. These offers should emphasize “we miss you” messaging, include bonus currency or exclusive items, and provide a clear path back into active play.
Whale-specific personalized offers, such as VIP bundles with high-ticket exclusive items or early access to new content, maintain engagement among top spenders and reduce churn risk. These offers must be handled carefully to avoid perception of pay-to-win imbalance or alienation of non-whale players. Transparency about VIP programs and ensuring that exclusive items don’t grant insurmountable competitive advantages help preserve community health.
Subscription and Battle-Pass Pricing
Monthly subscriptions should be priced to feel accessible ($3.99 to $7.99 is the sweet spot for most gacha titles) and deliver daily value that encourages login streaks. A $4.99 subscription that grants 150 premium currency per day, one stamina refill, and a small daily guaranteed reward provides $15 to $20 of equivalent value over the month, making the subscription feel like a bargain and increasing perceived ROI.
Annual or multi-month subscription discounts (e.g., $39.99 for 12 months vs. $59.88 paid monthly) increase lifetime subscriber value and reduce churn by locking in commitment. Offering a discounted first month or week trial lowers the barrier to entry and allows players to experience the value before committing to recurring billing. Track trial-to-paid conversion, renewal rates at each billing cycle, and average subscriber tenure to optimize pricing and benefits.
Battle passes or season passes priced at $9.99 to $19.99 per content season (typically 30 to 60 days) convert 1% to 5% of active players and generate significant incremental revenue while driving sustained engagement. Pass design should include both free and paid tracks so that non-paying players still participate and feel included, which preserves community health and provides a clear upgrade path for conversion.
Pass rewards should be front-loaded to deliver early value and back-loaded to incentivize completion. Offering the most desirable premium reward at the 70% to 80% completion milestone ensures that pass buyers stay engaged through most of the season, while early-tier rewards reduce buyer’s remorse and build momentum. Monitor completion rates (healthy battle passes see 60% to 80% of purchasers reaching at least 80% of milestones) and adjust difficulty, time requirements, or reward pacing if completion falls below 50%.
Testing Price Elasticity and Bundle Value
Systematic A/B testing of 4 to 6 price
Final Words
We started by laying out the sudden drop in gacha revenue, the main causes: player fatigue, confusing UX, and tighter rules, and the metrics that tell the true story.
Then we moved into fast fixes (clearer offers, fairer odds, timed promos) and longer-term moves (better retention loops, soft economy changes, split tests) so you can act now and learn fast.
Use the mobile gacha spending decline analysis and recovery strategies here as a checklist. With steady testing and player-first choices, recovery is realistic and measurable.
FAQ
Q: Why are gachas so addictive?
A: Gachas are so addictive because they mix variable rewards, near-miss wins, time-limited offers, and social pressure, triggering dopamine. Low-cost spins and visible progression make players keep trying for rare items.
Q: How to stop spending money on mobile games?
A: To stop spending money on mobile games, set a strict monthly budget, remove saved payment methods, enable device purchase limits, uninstall tempting apps, and wait 24 hours before any in-game purchase.
Q: What is the most successful mobile Gacha game?
A: The most successful mobile gacha game is Genshin Impact, known for billions in revenue, wide global reach, and high engagement thanks to its open world, regular updates, and high production values.
Q: Is gacha safe for 10 year olds?
A: Gacha is risky for 10 year olds because randomized purchases mimic gambling. Use parental controls, remove payment methods, set time and spending limits, and discuss odds and responsible play before allowing access.